
Venn Diagram is a visual representation to show relationships with commonalities or dissimilar properties between objects and finite groups of data. Although, to make Venn Diagrams, there is no exact illustration in Google Slides still it’s easy to create them for your presentation to improve the visual appeal.
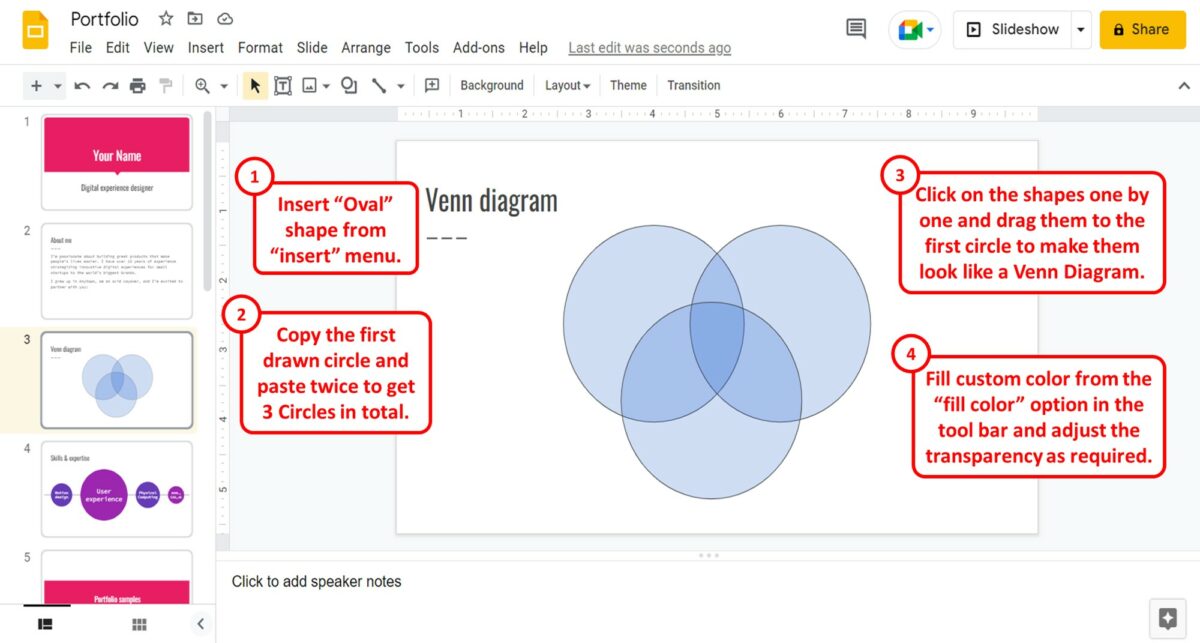
To make Venn Diagram in Google Slides, click on the “Shapes” option in the “Shapes” menu of the “insert” tab. Select the “Oval” shape and draw on the slide. “Copy” the shape and “Paste” it on the same slide. “Double-click” the pasted shape and drag it to overlap some part of the first circle.
You can also paste the circle twice and then adjust them to make 3-Circle Venn Diagram. Besides, “Fill color” tool in the toolbar allows you to fill the Venn Diagram with your desired colors by adjusting the transparency or typing in the color code in “Hex” box.
We have also provided the steps to add labels for the Venn Diagram in this article. If you are struggling with finding a tool to present your data in terms of comparison and contrast, continue reading for step-by-step guide to make Venn Diagrams in Google Slides:
1. What is a Venn Diagram?
A Venn Diagram is an infographic that represents a set. It is usually a set of circles that show the combination of one or several elements. It is useful in presentations since it gives the audience a simple visual representation of complex mathematical sets.
2. How to Create a 2-Circle Venn Diagram in Google Slides?
In Google Slides, you can easily create a 2-circle Venn Diagram on a slide. All you have to do is follow the 8 simple steps.
Step-1: Click on the “Insert” menu
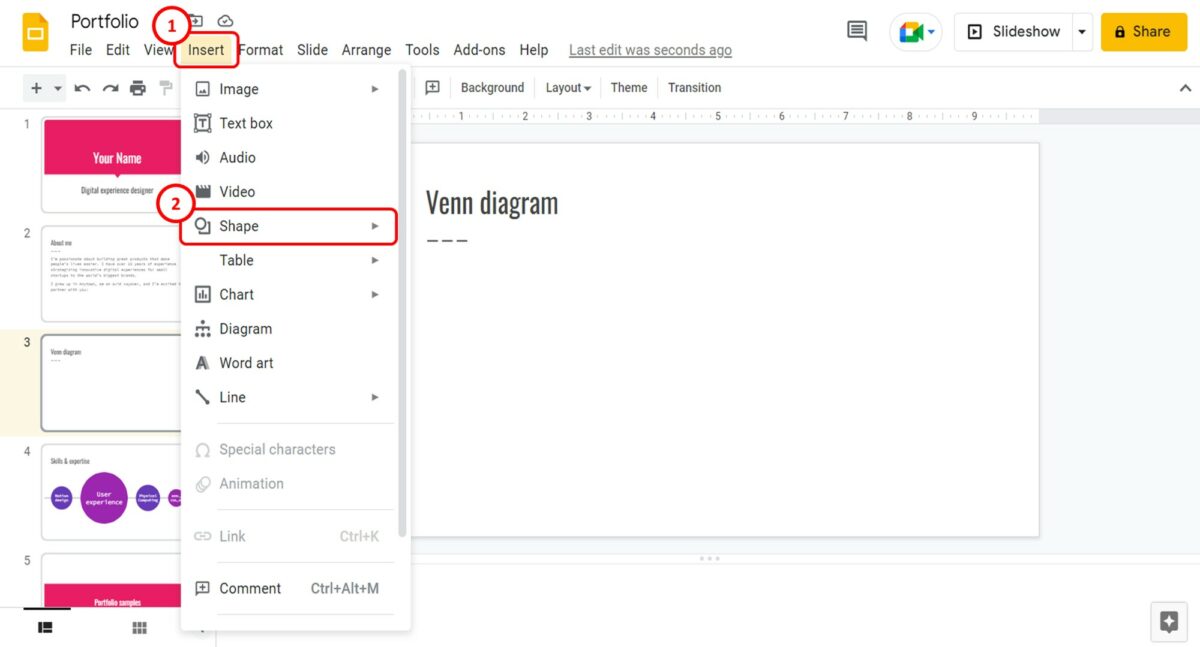
In the menu bar at the top of the screen, click on the “Insert” menu. In the “Insert” menu, click on the “Shape” option.
Step-2: Click on the “Shapes” option
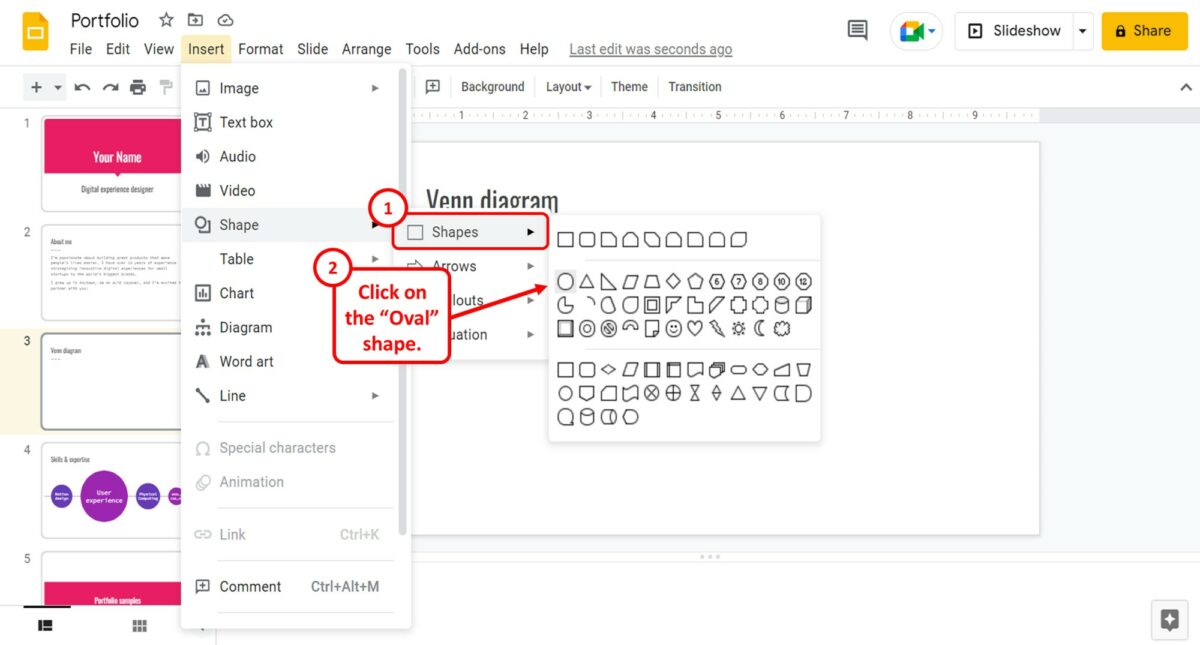
In the pop-up menu by the “Shape” option in the “Insert” menu, click on the “Shapes” option. Then all you have to do is click on the “Oval” shape.
Step-3: Click on the “Copy” option
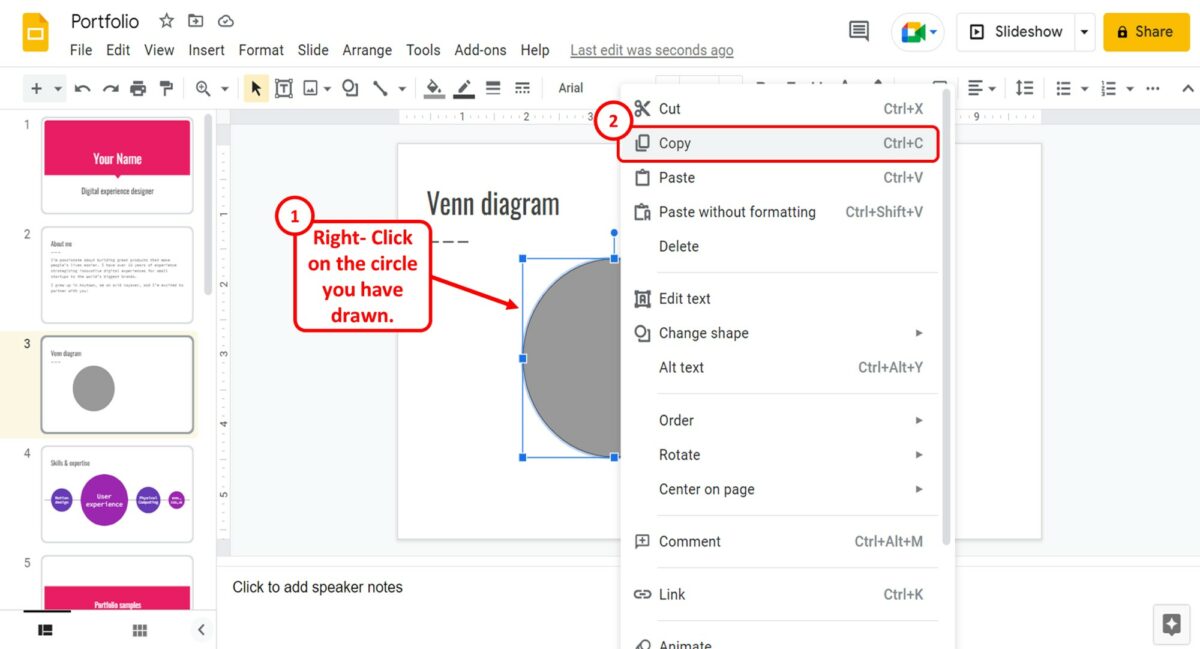
The next step is to copy the inserted circle on the slide. To do so, “Right Click” on the circle and select the “Copy” option from the right-click menu. Alternatively, you can press the “Ctrl+C” keys on your keyboard to copy the circle.
Step-4: Click on the “Paste” option
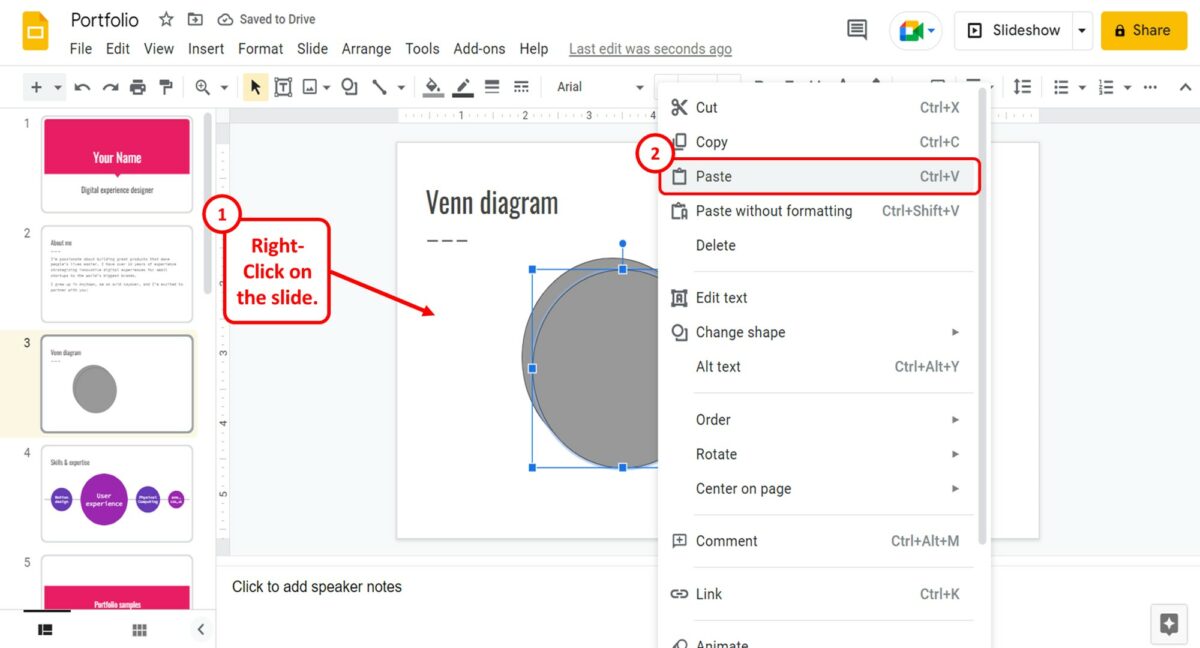
In the same slide, you have to now paste the circle to create two identical circles. “Right Click” on the slide and select the “Paste” option from the right-click menu. Alternatively, you can press the “Ctrl+V” keys on your keyboard.
Step-5: Move the circles
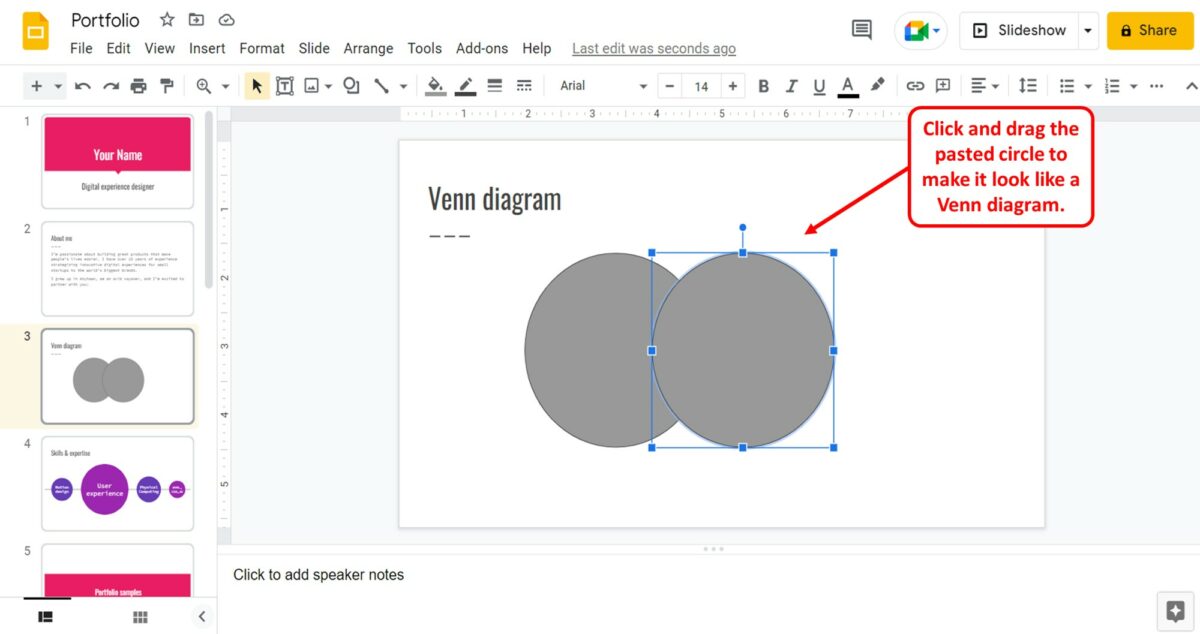
Now you have to move the circles so that they are positioned like a Venn Diagram. To do so, you can just click and drag the circles.
Step-6: Click on the “Group” option
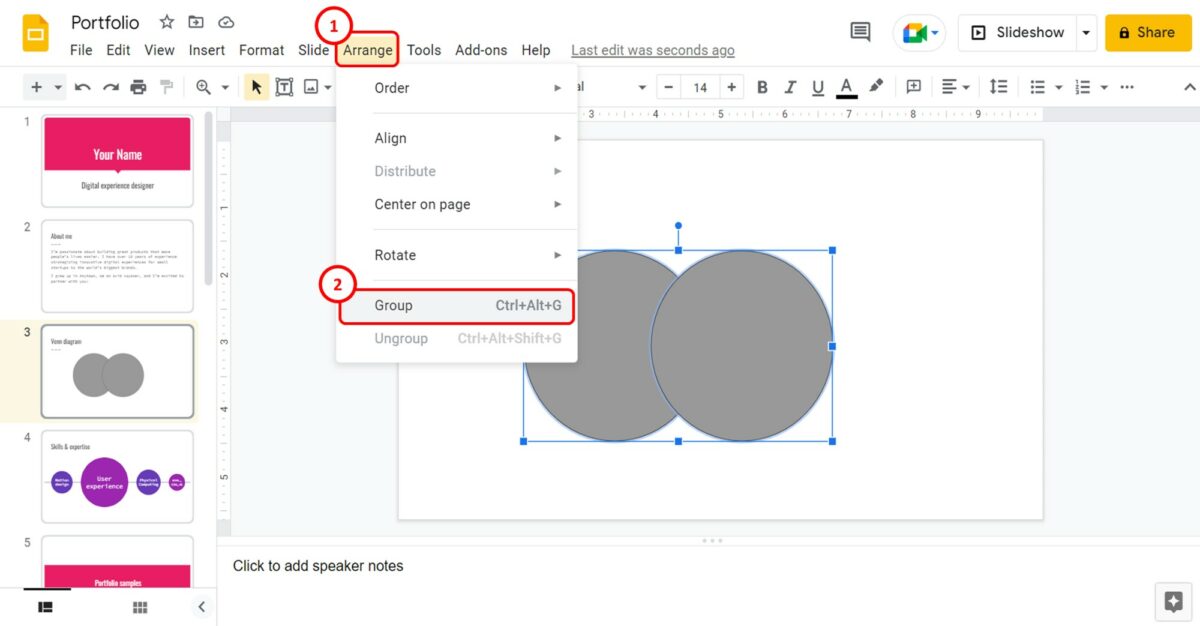
Once the circles are adjusted in their position, you have to group them together. Click on the “Arrange” menu at the top of the screen. In the “Arrange” menu, click on the “Group” option. You can alternatively press the “Ctrl+Alt+G” keys on your keyboard to group the circles.
Step-7: Click on the “Fill color” option
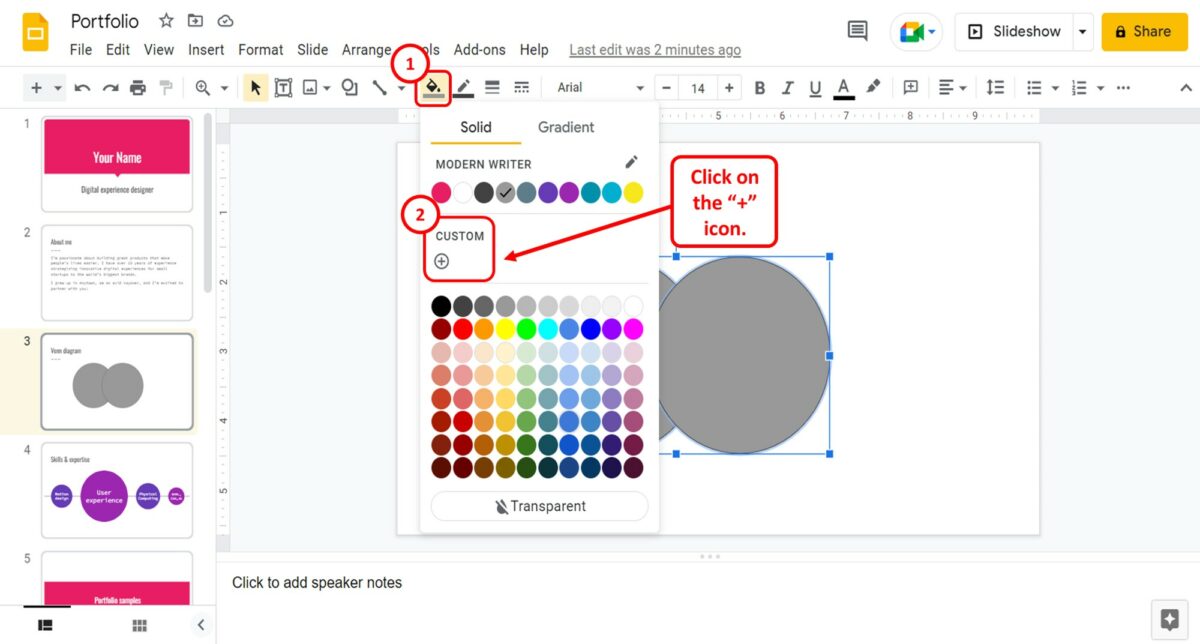
In the toolbar located under the menu bar at the top of the screen, click on the “Fill Color” option. It is the icon that looks like a paint bucket. In the dropdown menu under the “Fill Color” option, click on the “+” icon under the “Custom” section.
Step-8: Drag the “Transparency” slider
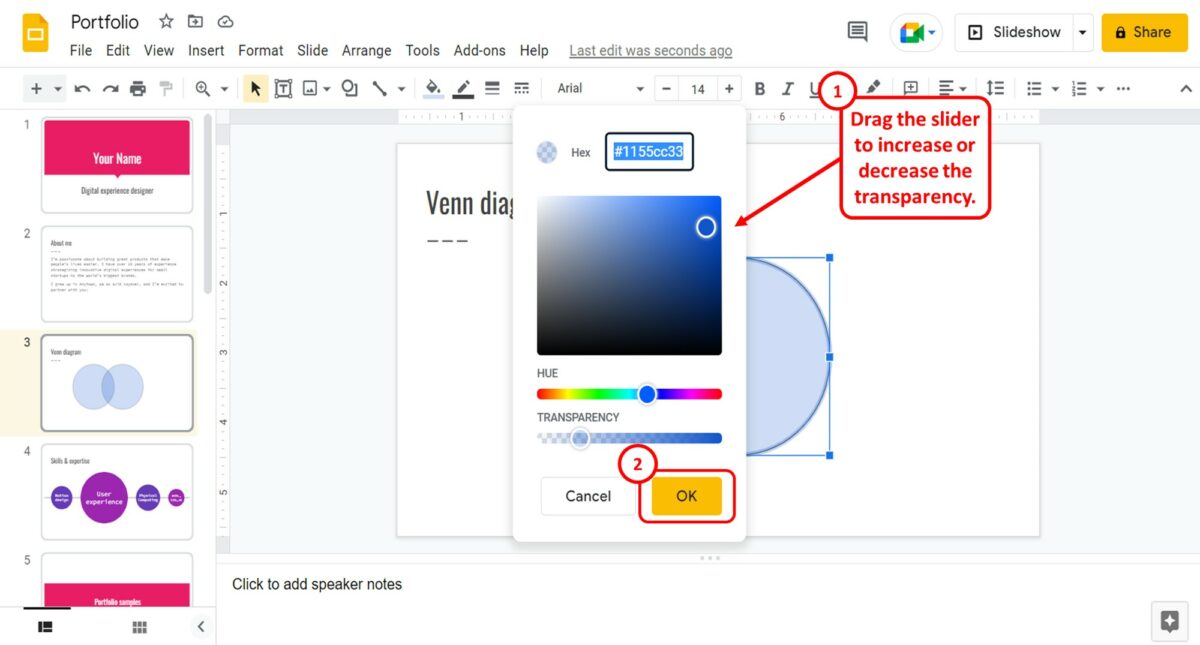
In the dialog box, you can now customize the Venn Diagram color. Drag the “Transparency” slider to the left to increase the transparency so that the circles look like a Venn Diagram. Then all you have to do is click on the “OK” button at the bottom of the dialog box to create the 2-circle Venn Diagram.
3. How to Create a 3-Circle Venn Diagram in Google Slides?
To create a Venn Diagram in Google Slides, you have to insert the “Oval” shape from the “Insert” menu. To insert a 3-circle Venn Diagram into the presentation slide, you can follow the steps detailed in section 2. All you have to do is repeat Step-4 twice to create 3 instead of 2 circles.
4. How to Change the Color of the Venn Diagram?
The “Fill color” option in Google Slides allows you to customize the color of any shape including a Venn Diagram. To change the color of a Venn Diagram on a slide, follow the 2 quick steps.
Step-1: Click on the “Fill color” option
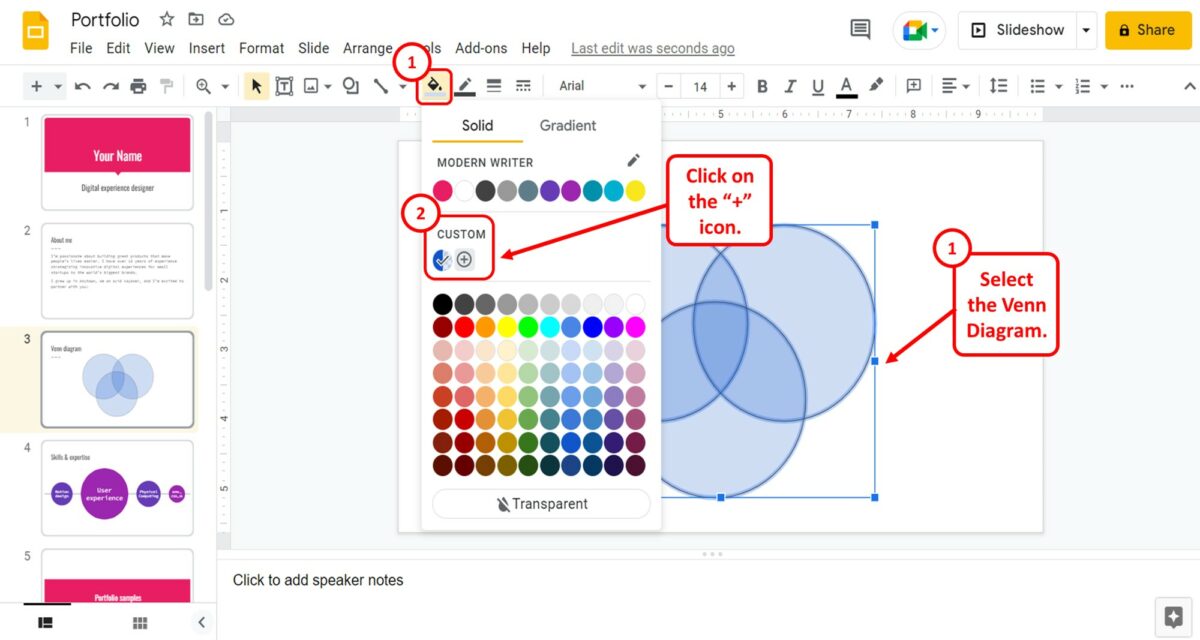
The first step is to select the Venn Diagram on the slide. Then click on the “Fill color” option which is the paint bucket icon in the toolbar located under the menu bar.
In the drop-down menu under the “Fill color” option, you can now select your preferred color. You can also click on the “+” icon in the “Custom” section to customize the color.
Step-2: Click on the “OK” button
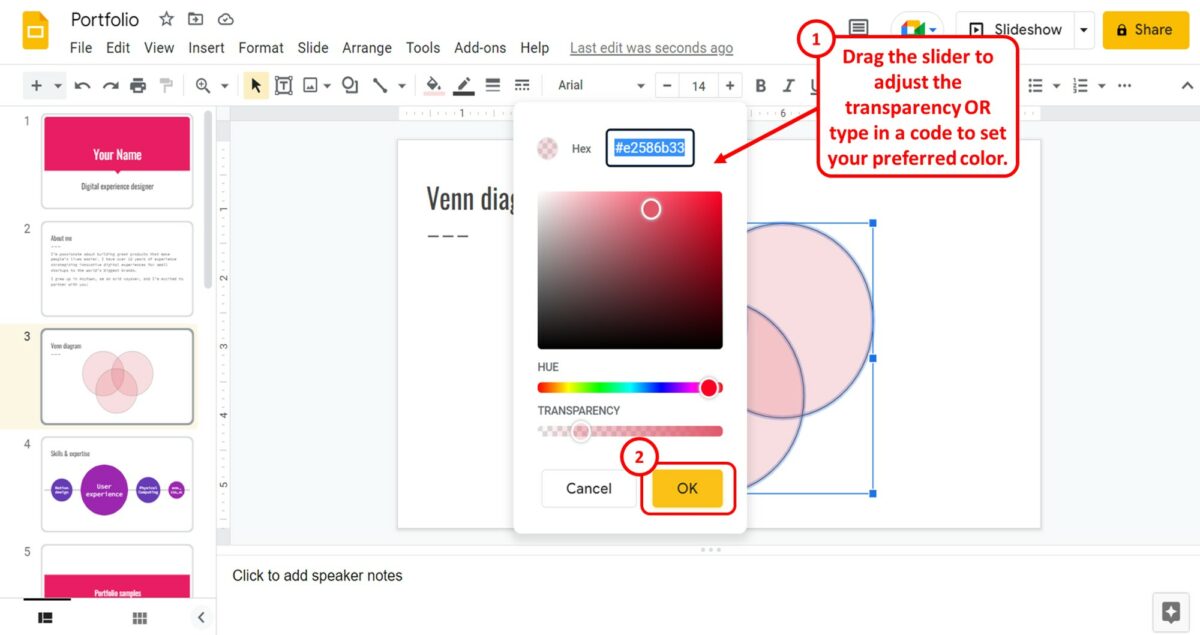
In the dialog box, you can now customize the color. You can also click on the “Hex” box at the top to type in your preferred color code. Finally, all you have to do is click on the “OK” button at the bottom of the dialog box to change the color of the selected Venn Diagram.
5. How to Add Labels for the Venn Diagram?
In Google Slides, you can add labels to shapes very easily using the “Double Click” method. However, if you want to customize the labels, then you can add the labels as text boxes.
5.1 Method 1 – Using the “Double Click” method
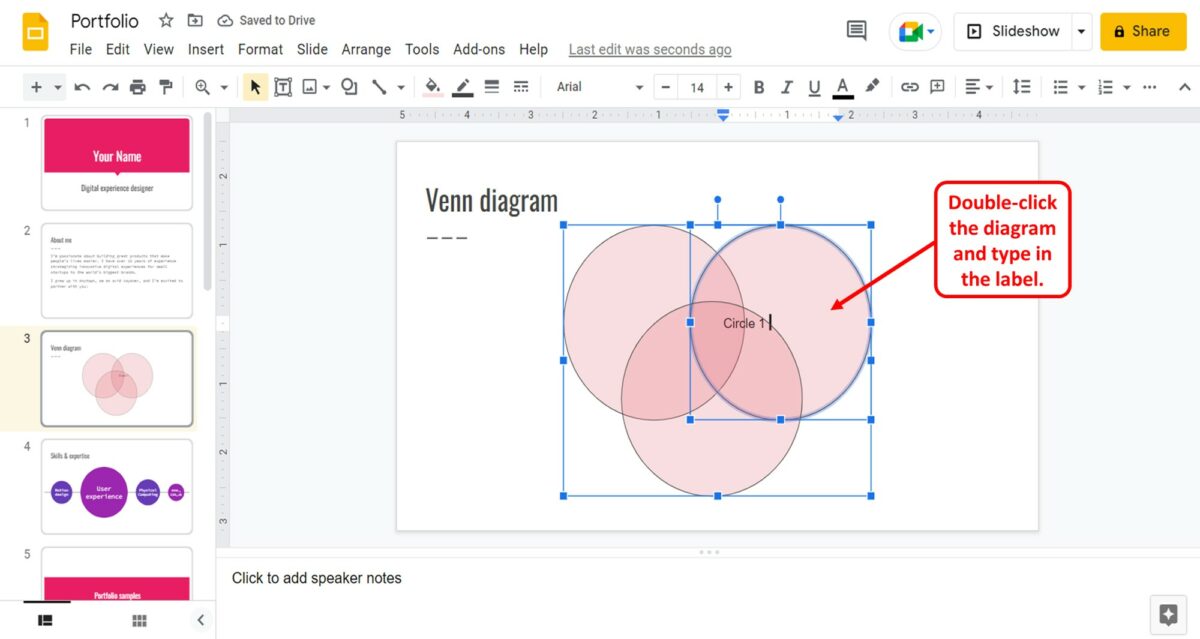
Using the “Double Click” method is a quick way to add labels to a Venn Diagram in Google Slides. All you have to do is “Double Click” on the Venn Diagram circle where you want to add the label. Then type in the label. However, you cannot customize the label in this method.
5.2 Method 2 – Using the “Text box” option
In Google Slides, you can add text in a text box. Using the “Text box” option for adding labels to a Venn Diagram is a better option since it allows you to customize, move and resize the label. You can also group the labels with the Venn Diagram. To add labels using the “Text box” option, follow the 4 easy steps.
Step-1: Click on the “Text box” option
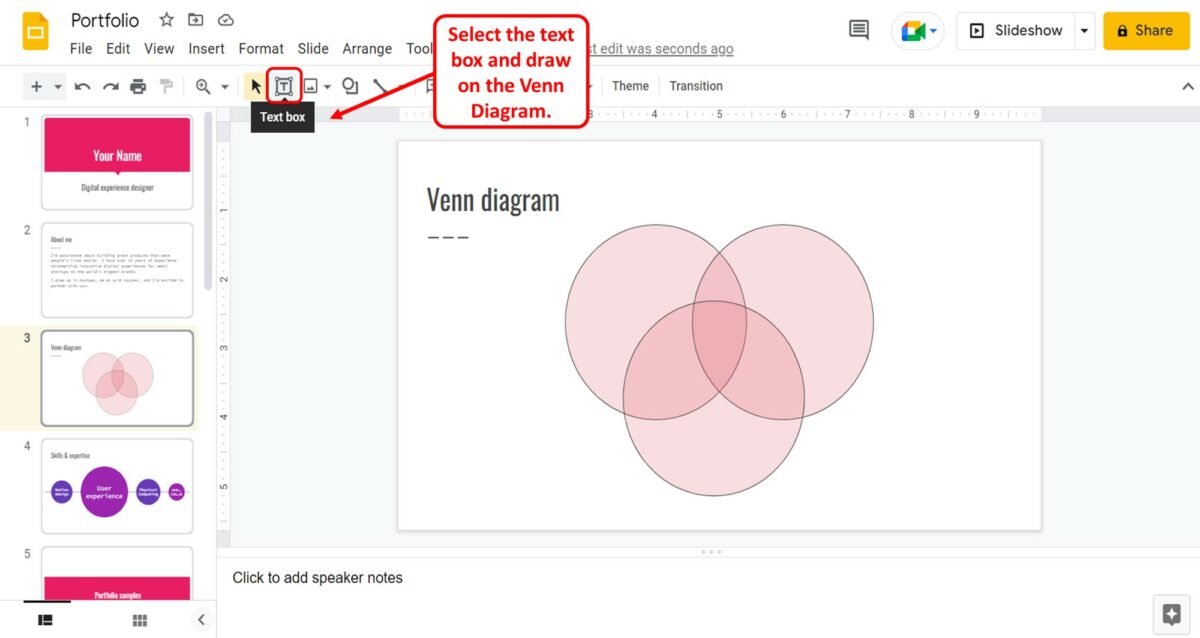
The first step is to click on the “Text box” option in the toolbar located under the menu bar at the top of the screen. You can then draw the text box on the Venn Diagram where you want to add the label.
Step-2: Move and resize the text box
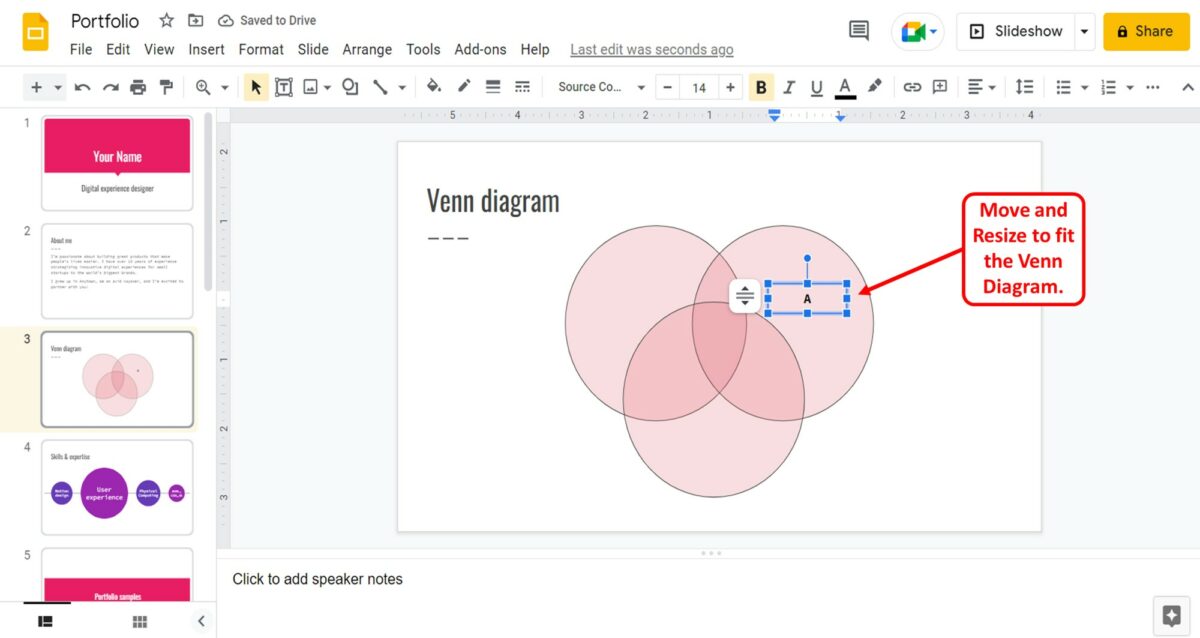
The next step is to type in the label for the Venn Diagram. You can move and resize the label to fit the Venn Diagram circles. You can also customize the font of the label to match the Venn Diagram.
Step-3: Repeat for each circle
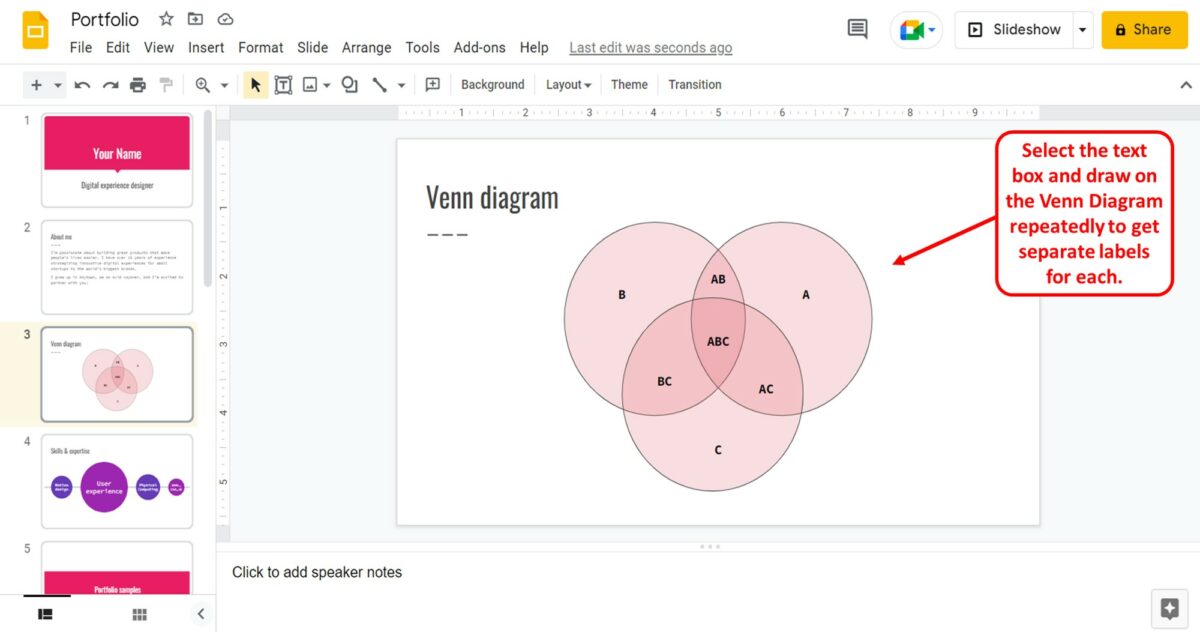
Now you have to repeat the steps to create separate labels for each Venn Diagram circle and the intersection.
Step-4: Click on the “Group” option
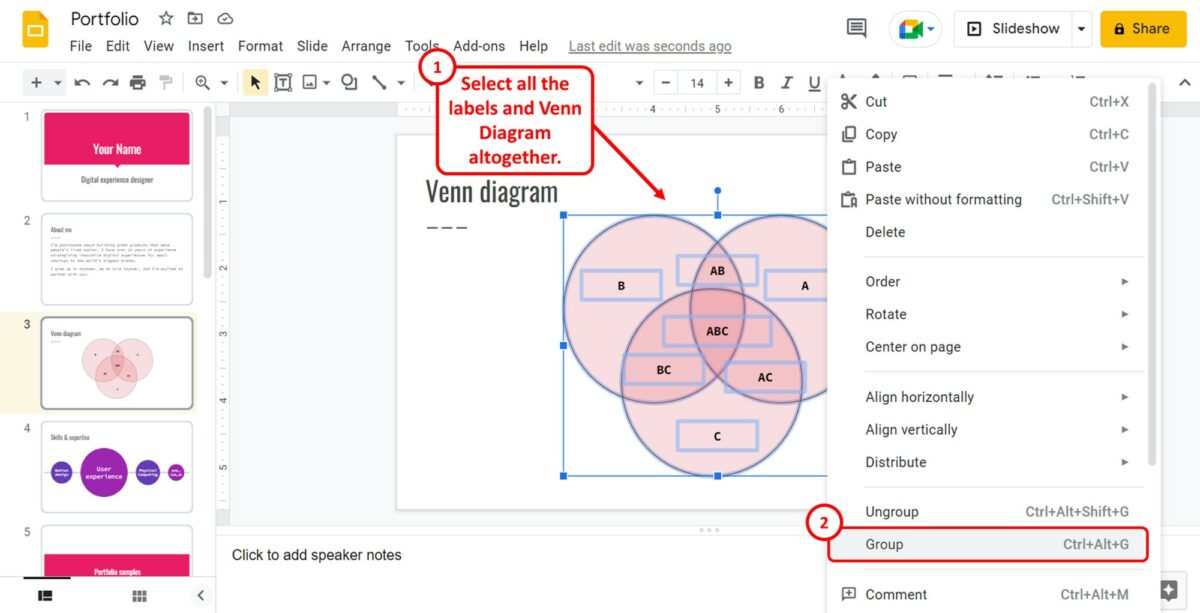
Finally, you have to group the text boxes with the Venn Diagram to make the diagram along with the labels a single object on the slide. All you have to do is select all the labels and the Venn Diagram and “Right Click” on it. In the right-click menu, click on the “Group” option.
You can alternatively press the “Ctrl+Alt+G” keys on your keyboard to group the labels with the Venn Diagram.