![How to Transpose Table in PowerPoint? [A Simple Solution!]](https://artofpresentations.com/wp-content/uploads/2022/02/Featured-Image-How-to-Transpose-Table-in-PowerPoint.webp)
Working with tables in PowerPoint can be a bit difficult at times. This is especially true when you have entered the incorrect data or perhaps when you have entered the data that should have been in columns rather than rows!
In such a scenario, is it possible to switch the data in rows and columns in PowerPoint?
To transpose the table in PowerPoint, copy and paste the table into a new Microsoft Excel file. Then, copy the cells once again in Excel, right-click on a new cell, select the “Paste Special” function, and click on the “Transpose” feature. Finally, copy the transposed cells from Excel to PowerPoint.
It may be a bit difficult to understand exactly what you need to do with the short answer mentioned above. Thus, in this article, I’ll show you the complete process to transpose the data from a table in PowerPoint in a complete step-by-step manner with visual aids!
So, let’s get started!
1. How to Switch Rows and Columns of a Table in PowerPoint?
Let’s get straight to the point.
As you may now be aware, there is no feature in PowerPoint that lets you transpose the information in the table in PowerPoint currently.
Thus, as I mentioned earlier in the article, in order to transpose a table in PowerPoint, you will need to take the help of Microsoft Excel if you want to avoid re-entering the information manually!
Here’s how to transpose the data in a table in PowerPoint –
Step 1 – Copy the Table from PowerPoint
The first step is to open the presentation slide that contains the table that you wish to transpose.
Then, select the table by clicking on the outside border and right-click on it. If you are unable to identify the selection point of the table, you can click anywhere inside the table and press the “Esc” key on your keyboard. Then, right-click on the table.
From the dropdown that appears, simply click on the “Copy” command.
You can also press the “Ctrl+C” shortcut keys to copy in PowerPoint once you have selected the table.
Step 2 – Paste the Table in an Excel Sheet
Start the Microsoft Excel application and open a blank document.
Then, someone on the sheet (preferably on the first cell), simply press right-click button on your mouse and select the “Paste” option from the dropdown.
Alternatively, you can also click on the “Ctrl+V” shortcut keys to paste the table that we selected from our PowerPoint presentation.
Step 3 – Copy the Table in Excel
Once you paste the table into the Excel file, you will need to select and copy it once again. Don’t worry about the formatting of the table or the cells. We will fix that in just a moment.
Now, all you need to do at this point is make sure that you select all the cells, right-click on them, and select “Copy” from the dropdown. Or, press the “Ctrl+C” keys to copy the cells once selected.
Step 4 – Transpose the Table in Excel
Here’s the crucial part where we transpose the data in the table.
Once you have copied the cells in excel, simply select a cell in any other location in the Excel file, right-click on it, click on the “Paste Special” option from the dropdown, and finally click on the “Transpose” option.
This will basically switch the rows and columns of the table.
Step 5 – Format the Transposed Data
Now, one thing that you need to make sure of is to adjust the size of the rows and columns such that the data within the cells is visible.
You can either adjust the width and height of the rows and columns. If you don’t know how to do that, you can alternatively select all the cells of the transposed data and reduce the font size so that all the text appears in the cells.
Step 6 – Copy the Transposed Data
Although the data has been transposed in the table, it is still currently present only in the excel sheet. Now we need to make sure that we put it back into our PowerPoint presentation.
To do that, first, select the cells and right-click on them. Then, from the dropdown, click on the “Copy” command.
Step 7 – Duplicate the Slide
Now, go back to your PowerPoint presentation. First, let’s make sure we have a copy of the slide containing the original table.
To ensure that we maintain a copy of the original slide, we shall duplicate the original slide. To do that, select the slide in the “Slide Preview” pane, and right-click on it. Then, from the dropdown, click on the “Duplicate Slide” option.
Step 8 – Delete the Old Table on the Duplicate Slide
On the duplicate slide that has been added, let us now delete the table as we already have the original table on another slide. This will allow us to add the new table with the transposed data.
To delete a table in PowerPoint, first, select the table by clicking on its border. Then, click on the “Layout” tab. Next, click on the “Delete” option, and from the dropdown, select the “Delete Table” option.
This will delete the table from the slide.
Step 9 – Paste the Transposed Data from Excel
In the next step, we will need to paste the transposed data from excel to your slide in PowerPoint.
However, the normal paste function will remove the formatting of the table. Thus, in order to make sure that we retain the original formatting of the table, we will need to use the “Paste Special” feature in PowerPoint.
Click on the “Home” tab in PowerPoint. Then, click on the “Paste Special” option (or the “Paste” option in PowerPoint on Mac), and from the dropdown, click on the “Keep Source Formatting” option.
Step 10 – Adjust and Format the Table
This will paste the table that contains the transposed data and retain the formatting of the original table in PowerPoint.
Now, all you need to do is simply resize and move the table on the slide as you deem fit. You can also format the table by adjusting the rows and columns of this table.
To give a professional look to your table once you’ve adjusted the row and column size, use the distribute row and column option in PowerPoint.
Simply select the table. Then, click on the contextual “Layout” tab. Finally, click on the “Distribute Rows” and “Distribute Columns” options to make all the cells of the table look even.
2. How to Switch Rows and Columns of a Graph in PowerPoint?
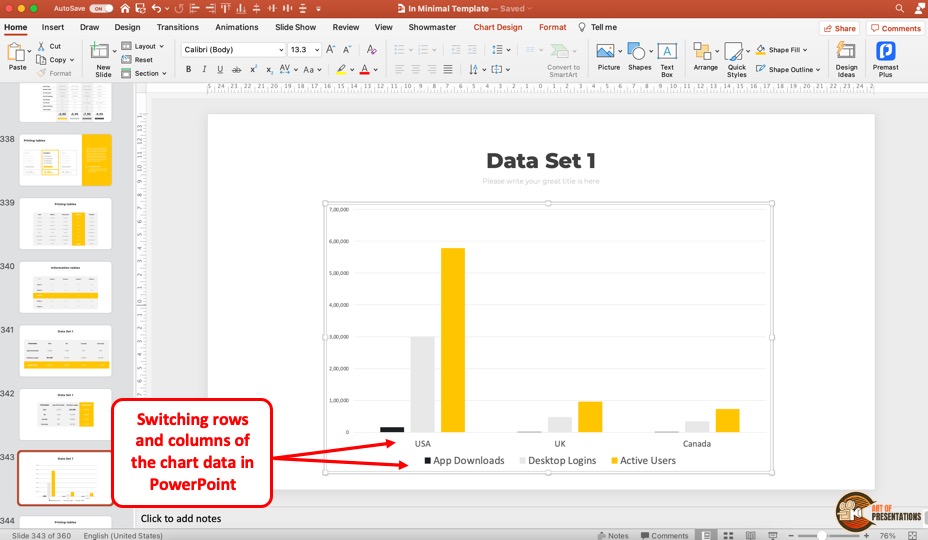
Sometimes, all you want to do is simply switch the rows and columns of the table that contains the data for a graph in PowerPoint so that you can switch the data that is represented on the graph.
Thankfully, to achieve this, you don’t have to do the elaborate steps that I’ve described in the first section of this article.
Let’s take a look at how to switch rows and columns for a graph in PowerPoint.
Step 1 – Open the “Chart Design” Tab
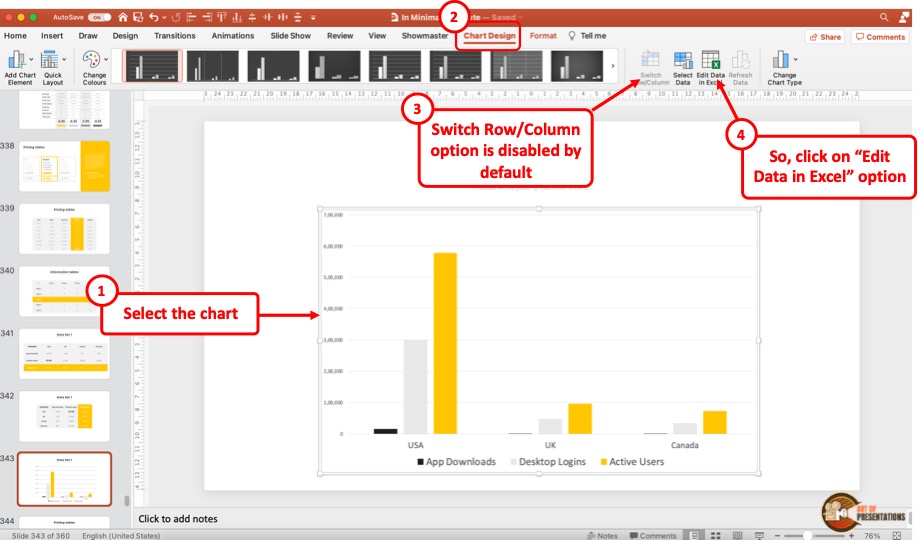
First, select the graph for which you intend to switch the rows and columns.
Then, click on the contextual “Chart Design” tab that will appear when the graph is selected. You will notice that there is an option to switch row/column on the chart design ribbon.
However, it is disabled by default. To enable it, you will need to start editing the data of the graph in excel. Thus, click on the “Edit Data in Excel” option.
Step 2 – Switch Back to PowerPoint
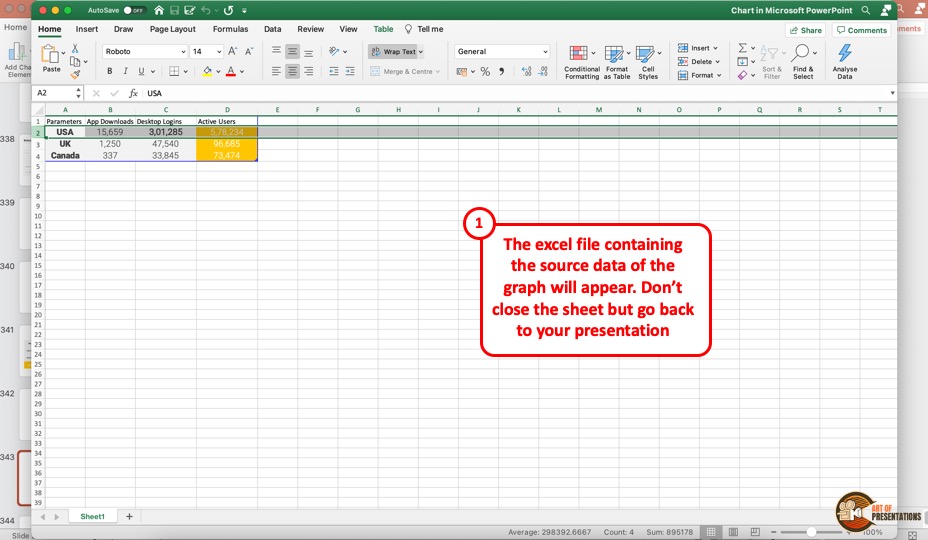
Clicking on the “Edit Data in Excel” option will open an excel sheet. You don’t need to transpose the data here (although you could do that too). So, simply go back to the PowerPoint presentation without closing this excel file.
You can use the “Alt+Tab” shortcut keys (Cmd+Tab on Mac) to switch back and forth between the Excel sheet and PowerPoint file. Alternatively, you can also click on the PowerPoint file that is visible in the background.
Step 3 – Click on the “Switch Row/Column” Option
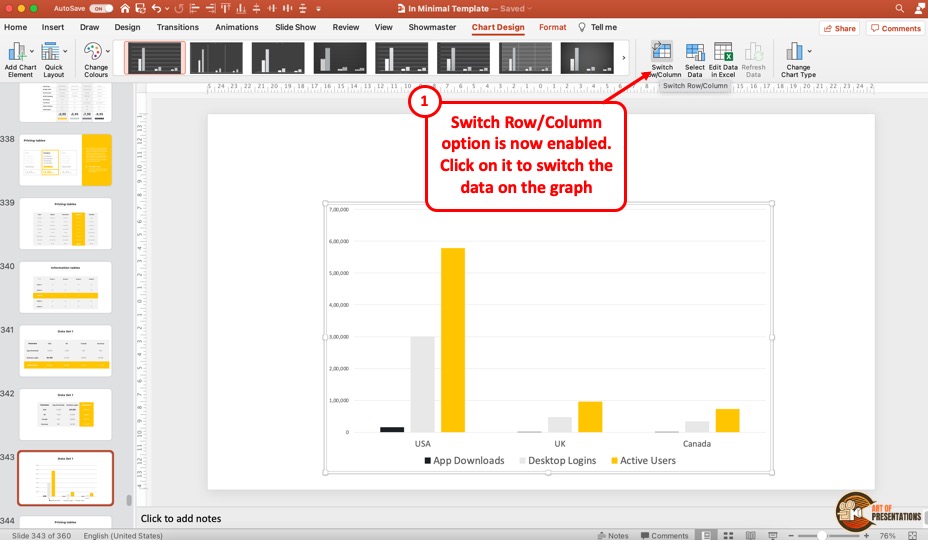
Now you will notice that the command to switch the rows and columns in a graph is enabled. So, simply click on it and you will see that the data in the graph will change as you click on the button
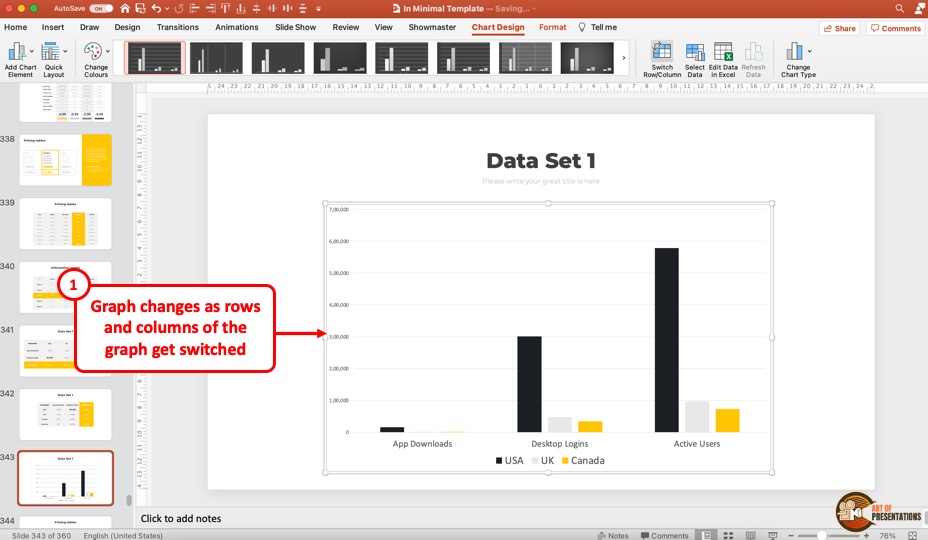
The data representation changes as the rows and columns of the table containing the data source are switched!
3. How to Rotate a Table in PowerPoint?
In some cases, we don’t necessarily want to switch the rows and columns of a table or transpose the table in PowerPoint. All we want to do is rotate the table. How do you do that?
PowerPoint does not allow you to rotate the table by default. However, as a workaround, you can copy and paste the table as an image on a slide and then rotate it. To do that, first, copy the table. Then, right-click on the slide, choose the “Paste Special” option, and click on “Paste as Picture”.
However, the biggest drawback to this process is that you won’t be able to edit your table once you paste it as a picture. Thus, it is highly advisable to carry out this process once you have entered all the information in the table and formatted it as per your requirement.
It is also recommended that you keep the slide that contains the table in the editable format secure so that you can make changes if the need ever arises.
With that, let’s understand the process in further detail –
Step 1 – Copy the Table
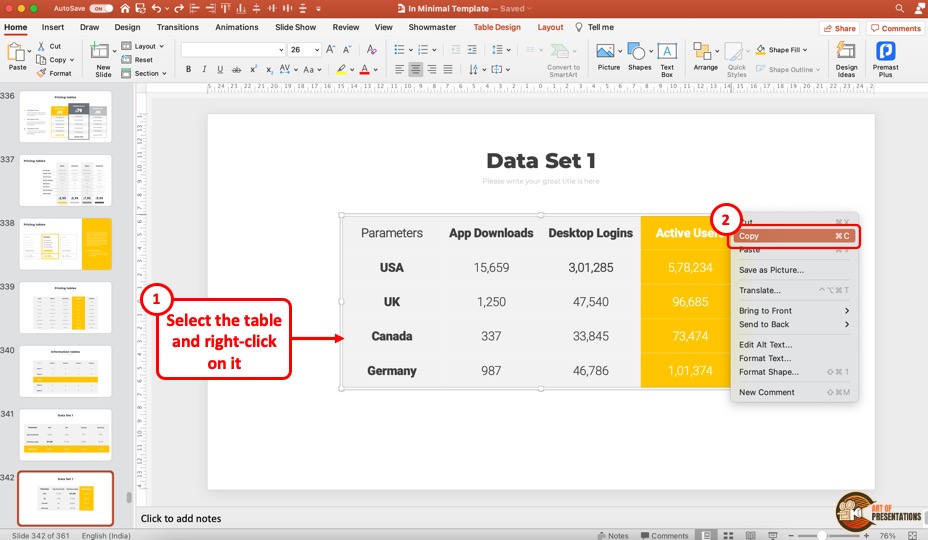
The first step is to copy the table that you wish to rotate in PowerPoint.
Select the table and right-click on it. Then, from the dropdown, click on the “Copy” option.
Step 2 – Paste the Table as Picture
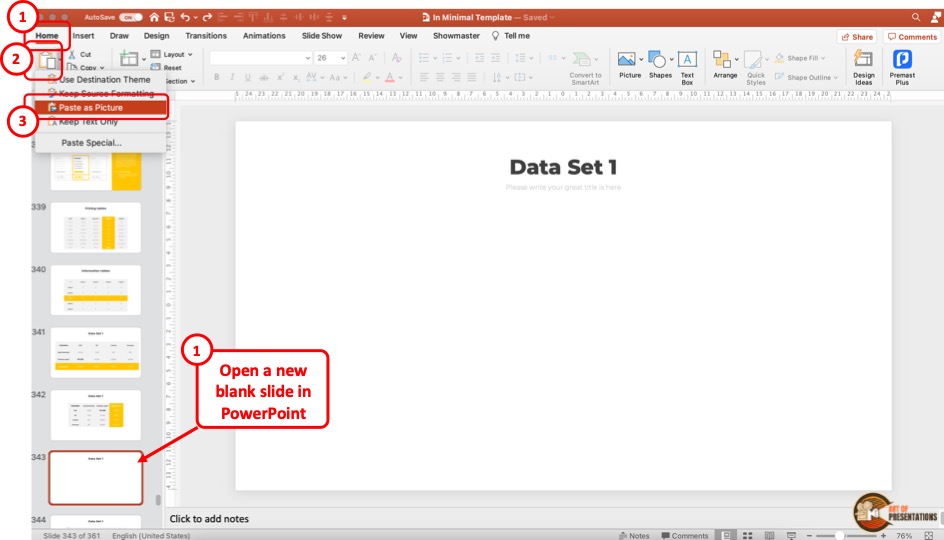
Now, we need to paste the table as an image.
To do that, click on the “Home” tab. Next, click on the “Paste Special” option (or the “Paste” option on Mac). From the dropdown, click on the “Paste as Picture” option.
Step 3 – Rotate the Picture of the Table
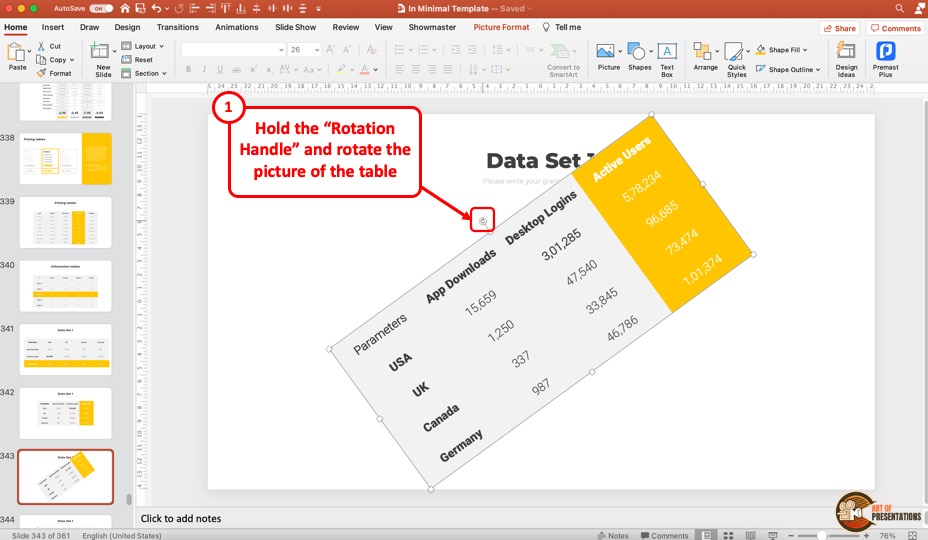
Doing so will paste the table as an image on the slide in PowerPoint. Now, you can rotate the table just as you would rotate a picture on the slide.
Simply hold the rotation handle on top of the picture and move it in any one direction on the slide. This will rotate the table.
Credit to wayhomestudio (on Freepik) for the featured image of this article (further edited).
- How to Switch Rows and Columns of a Table in PowerPoint?
- How to Switch Rows and Columns of a Graph in PowerPoint?
- How to Rotate a Table in PowerPoint?