As a researcher, it is quite pointless to do the research if we are unable to share the findings with our audience appropriately! Using PowerPoint is one of the best ways to present research outcomes. But, how does one present qualitative research findings using PowerPoint?
In order to present the qualitative research findings using PowerPoint, you need to create a robust structure for your presentation, make it engaging and visually appealing, present the patterns with explanations for it and highlight the conclusion of your research findings.
In this article, we will help you understand the structure of your presentation. Plus, we’ll share some handy tips that will make your qualitative research presentation really effective!
How to Create a Structure for your Qualitative Research Presentation?
Creating the right structure for your presentation is key to ensuring that it is correctly understood by your audience.
The structure of your Research Presentation not only makes it easier for you to create the document, it also makes it simple for the audience to understand what all will be covered in the presentation at the time of presenting it to your audience.
Furthermore, having a robust structure is a great way to ensure that you don’t miss out on any of the points while working on creating the presentation.
But, what structure should one follow?
Creating a good structure can be tricky for some. Thus, I’m sharing what has worked well for me during my previous research projects.
NOTE –
It is important to note that although the following structure is highly effective for most research findings presentation, it has been generalized in order to serve a wide range of research projects. You may want to take a look at points that are very specific to the nature of your research project and include them at your discretion.
Here’s my recommended structure to create your Research Findings presentation –
1. Objective of the Research
A great way to start your presentation is to highlight the objective of your research project.
It is important to remember that merely sharing the objective may sometimes not be enough. A short backstory along with the purpose of your research project can pack a powerful punch! It not only validates the reasoning for your project but also subtly establishes trust with your audience.
However, do make sure that you’re not reading the backstory from the slide. Let it flow naturally when you are delivering the presentation. Keep the presentation as minimalistic as possible.
2. Key Parameters Considered for Measurement
Once you’ve established the objective, the next thing that you may want to do is perhaps share the key parameters considered for the success of your project.
Every research project, including qualitative research, needs to have a few key parameters to measure against the objective of the research.
For example – If the goal of your project is to gather the sentiments of a certain group of people for a particular product, you may need to measure their feelings. Are they happy or unhappy using the product? How do they perceive the branding of the product? Is it affordable?
Make sure that you list down all such key parameters that were considered while conducting the qualitative research.
In general, laying these out before sharing the outcome can help your audience think from your perspective and look at the findings from the correct lens.
3. Research Methodology Adopted
The next thing that you may want to include in your presentation is the methodology that you adopted for conducting the research.
By knowing your approach, the audience can be better prepared for the outcome of your project. Ensure that you provide sound reasoning for the chosen methodology.
This section of your presentation can also showcase some pictures of the research being conducted. If you have captured a video, include that. Doing this provides further validation of your project.
4. Research Outcomes (Presenting Descriptive Analysis)

This is the section that will constitute the bulk of the your presentation.
Use the slides in this section to describe the observations, and the resulting outcomes on each of the key parameters that were considered for the research project.
It is usually a good idea to dedicate at least 1 or more slides for each parameter. Make sure that you present data wherever possible. However, ensure that the data presented can be easily comprehended.
Provide key learnings from the data, highlight any outliers, and possible reasoning for it. Try not to go too in-depth with the stats as this can overwhelm the audience. Remember, a presentation is most helpful when it is used to provide key highlights of the research!
Apart from using the data, make sure that you also include a few quotes from the participants.
5. Summary and Learnings from the Research
Once you’ve taken the audience through the core part of your research findings, it is a good practice to summarize the key learnings from each of the section of your project.
Make sure your touch upon some of the key learnings covered in the research outcome of your presentation.
Furthermore, include any additional observations and key points that you may have had which were previously not covered.
The summary slide also often acts as “Key Takeaways” from the research for your audience. Thus, make sure that you maintain brevity and highlight only the points that you want your audience to remember even after the presentation.
6. Inclusions and Exclusions (if any)
While this can be an optional section for some of the researchers.
However, dedicating a section on inclusions and exclusions in your presentation can be a great value add! This section helps your audience understand the key factors that were excluded (or included) on purpose!
Moreover, it creates a sense of thoroughness in the minds of your audience.
7. Conclusion of the Research
The purpose of the conclusion slide of your research findings presentation is to revisit the objective, and present a conclusion.
A conclusion may simply validate or nullify the objective. It may sometimes do neither. Nevertheless, having a conclusion slide makes your presentation come a full circle. It creates this sense of completion in the minds of your audience.
8. Questions
Finally, since your audience did not spend as much time as you did on the research project, people are bound to have a few questions.
Thus, the last part of your presentation structure should be dedicated to allowing your audience to ask questions.
Tips for Effectively Presenting Qualitative Research Findings using PowerPoint
For a presentation to be effective, it is important that the presentation is not only well structured but also that it is well created and nicely delivered!
While we have already covered the structure, let me share with you some tips that you can help you create and deliver the presentation effectively.
Tip 1 – Use Visuals

Using visuals in your presentation is a great way to keep the presentations engaging!
Visual aids not only help make the presentation less boring, but it also helps your audience in retaining the information better!
So, use images and videos of the actual research wherever possible. If these do not suffice or do not give a professional feel, there are a number of resources online from where you can source royalty-free images.
My recommendation for high-quality royalty-free images would be either Unsplash or Pexels. Both are really good. The only downside is that they often do not provide the perfect image that can be used. That said, it can get the job done for at least half the time.
If you are unable to find the perfect free image, I recommend checking out Dreamstime. They have a huge library of images and are much cheaper than most of the other image banks. I personally use Dreamstime for my presentation projects!
Tip 2 – Tell a Story (Don’t Show Just Data!)
I cannot stress enough on how important it is to give your presentation a human touch. Delivering a presentation in the form of a story does just that! Furthermore, storytelling is also a great tool for visualization.
Data can be hard-hitting, whereas a touching story can tickle the emotions of your audience on various levels!
One of the best ways to present a story with your research project is to start with the backstory of the objective. We’ve already talked about this in the earlier part of this article.
Start with why is this research project is so important. Follow a story arc that provides an exciting experience of the beginning, the middle, and a progression towards a climax; much like a plot of a soap opera.
Tip 3 – Include Quotes of the Participants
Including quotes of the participants in your research findings presentation not only provides evidence but also demonstrates authenticity!
Quotes function as a platform to include the voice of the target group and provide a peek into the mindset of the target audience.
When using quotes, keep these things in mind –
1. Use Quotes in their Unedited Form
When using quotes in your presentation, make sure that you use them in their raw unedited form.
The need to edit quotes should be only restricted to aid comprehension and sometimes coherence.
Furthermore, when editing the quotes, make sure that you use brackets to insert clarifying words. The standard format for using the brackets is to use square brackets for clarifying words and normal brackets for adding a missing explanation.
2. How to Decide which Quotes to Consider?
It is important to know which quotes to include in your presentation. I use the following 3 criteria when selecting the quote –
- Relevance – Consider the quotes that are relevant, and trying to convey the point that you want to establish.
- Length – an ideal quote should be not more than 1-2 sentences long.
- Choose quotes that are well-expressed and striking in nature.
3. Preserve Identity of the Participant
It is important to preserve and protect the identity of the participant. This can be done by maintaining confidentiality and anonymity.
Thus, refrain from using the name of the participant. An alternative could be using codes, using pseudonyms (made up names) or simply using other general non-identifiable parameters.
Do note, when using pseudonyms, remember to highlight it in the presentation.
If, however, you do need to use the name of the respondent, make sure that the participant is okay with it and you have adequate permissions to use their name.
Tip 4 – Make your Presentation Visually Appealing and Engaging
It is quite obvious for most of us that we need to create a visually appealing presentation. But, making it pleasing to the eye can be a bit challenging.
Fortunately, we wrote a detailed blog post with tips on how to make your presentation attractive. It provides you with easy and effective tips that you can use even as a beginner! Make sure you check that article.
In addition to the tips mentioned in the article, let me share a few things that you can do which are specific to research outcome presentations.
4.1 Use a Simple Color Scheme
Using the right colors are key to make a presentation look good.
One of the most common mistakes that people make is use too many colors in their presentation!
My recommendation would be to go with a monochromatic color scheme in PowerPoint.
4.2 Make the Data Tables Simple and Visually Appealing
When making a presentation on research outcomes, you are bound to present some data.
But, when data is not presented in a proper manner, it can easily and quickly make your presentation look displeasing! The video below can be a good starting point.
Using neat looking tables can simply transform the way your presentation looks. So don’t just dump the data from excel on your PowerPoint presentation. Spend a few minutes on fixing it!
4.3 Use Graphs and Charts (wherever necessary)
When presenting data, my recommendation would be that graphs and charts should be your first preference.
Using graphs or charts make it easier to read the data, takes less time for the audience to comprehend, and it also helps to identify a trend.
However, make sure that the correct chart type is used when representing the data. The last thing that you want is to poorly represent a key piece of information.
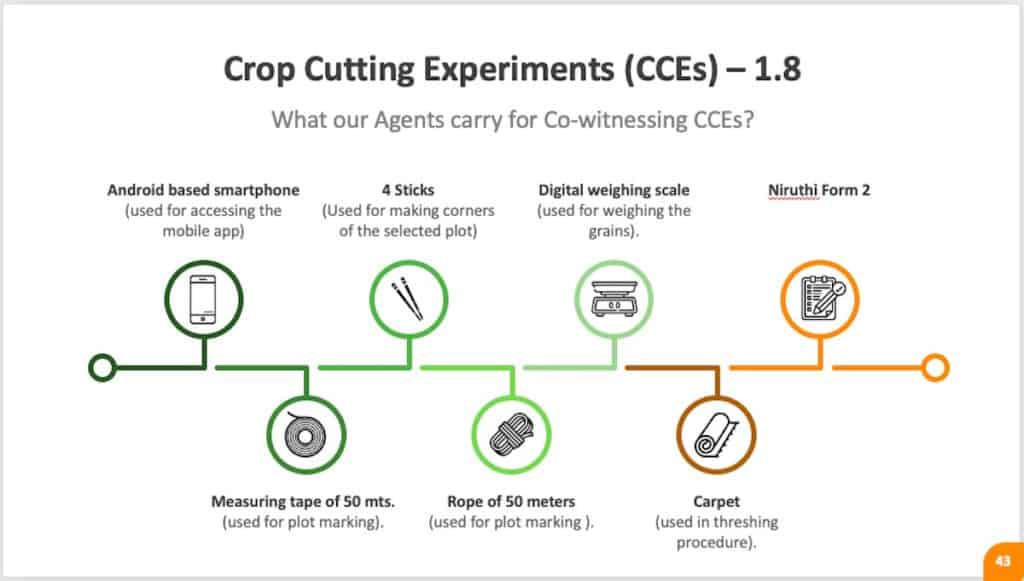
4.4 Use Icons instead of Bullet Points
Consider the following example –

This slide could have been created just as easily using bullet points. However, using icons and representing the information in a different format makes the slide pleasing on the eye.
Thus, always try to use icons wherever possible instead of bullet points.
Tip 5 – Include the Outliers
Many times, as a research project manager, we tend to focus on the trends extracted from a data set.
While it is important to identify patterns in the data and provide an adequate explanation for the pattern, it is equally important sometimes to highlight the outliers prominently.
It is easy to forget that there may be hidden learnings even in the outliers. At times, the data trend may be re-iterating the common wisdom. However, upon analyzing the outlier data points, you may get insight into how a few participants are doing things successfully despite not following the common knowledge.
That said, not every outlier will reveal hidden information. So, do verify what to include and what to exclude.
Tip 6 – Take Inspiration from other Presentations
I admit, making any presentation can be a tough ask let alone making a presentation for showcasing qualitative research findings. This is especially hard when we don’t have the necessary skills for creating a presentation.
One quick way to overcome this challenge could be take inspiration from other similar presentations that we may have liked.
There is no shame in being inspired from others. If you don’t have any handy references, you can surely Google it to find a few examples.
One trick that almost always works for me is using Pinterest.
But, don’t just directly search for a research presentation. You will have little to no success with it. The key is to look for specific examples for inspiration. For eg. search for Title Slide examples, or Image Layout Examples in Presentation.
Tip 7 – Ask Others to Critic your Presentation
The last tip that I would want to provide is to make sure that you share the presentation with supportive colleagues or mentors to attain feedback.
This step can be critical to iron out the chinks in the armor. As research project manager, it is common for you to get a bit too involved with the project. This can lead to possibilities wherein you miss out on things.
A good way to overcome this challenge is to get a fresh perspective on your project and the presentation once it has been prepared.
Taking critical feedback before your final presentation can also prepare you to handle tough questions in an adept manner.
Final Thoughts
It is quite important to ensure that we get it right when working on a presentation that showcases the findings of our research project. After all, we don’t want to be in a situation wherein we put in all the hard-work in the project, but we fail to deliver the outcome appropriately.
I hope you will find the aforementioned tips and structure useful, and if you do, make sure that you bookmark this page and spread the word. Wishing you all the very best for your project!

![[Guide] How to Present Qualitative Research Findings in PowerPoint?](https://artofpresentations.com/wp-content/uploads/2020/09/Featured-Image-Present-qualitative-findings-using-Powerpoint.jpg)